Around this time last year, Danny Najera spoke to PSBA about how technology was integrating with bees by tracking data from sensor devices placed into hives. Arnia, a hive monitor manufacturer, figured out how to get the weight, temperature, and humidity of a hive, and stream it over a 4g internet connection directly into a database that can be accessed through a web interface in any browser.
Wow! As a data geek, this was music to my ears. I immediately got in touch with Danny and told him how we could use my company’s software, called Qlik Sense, to visualize this data, and create an interface for him to run his analysis. With a few clicks, Danny can see how much honey has been produced on any single day. He can also compare the vital statistics of various different hives.
Soon, we can add additional data points into the application, such as the type of bee. Then, we can compare how Carniolians do overwinter versus Italians. People say that Carniolians do better, but I want to know what the data has to say about it!
In the initial version of this application, Danny’s hive collected over a year’s worth of data. As we aggregated the hourly data up into the day, then to the week, then to the month, we can start to see some trends begin to form.
 The chart at left shows the average weight of hives (red bars), aggregated to the month, with the average “Energy Consumption” (blue line) overlaying it. “Energy Consumption” is the difference between the temperature outside the hive, and the temperature inside the hive. This chart immediately starts to tell a story of the 2015 beekeeping season in our area.
By looking at this data, I can see three major events of note that had an impact on our hives. The first is the blackberry flow in early June. This is the major food source of the hive for the year, and you can see how the weight of the hive more than doubled in less than 30 days. The hive that provided this data, Isabel, was pulling honey in at a peak rate of 6.8 lbs per day! In just 8 days, she was able to haul in 54.9 lbs of honey.
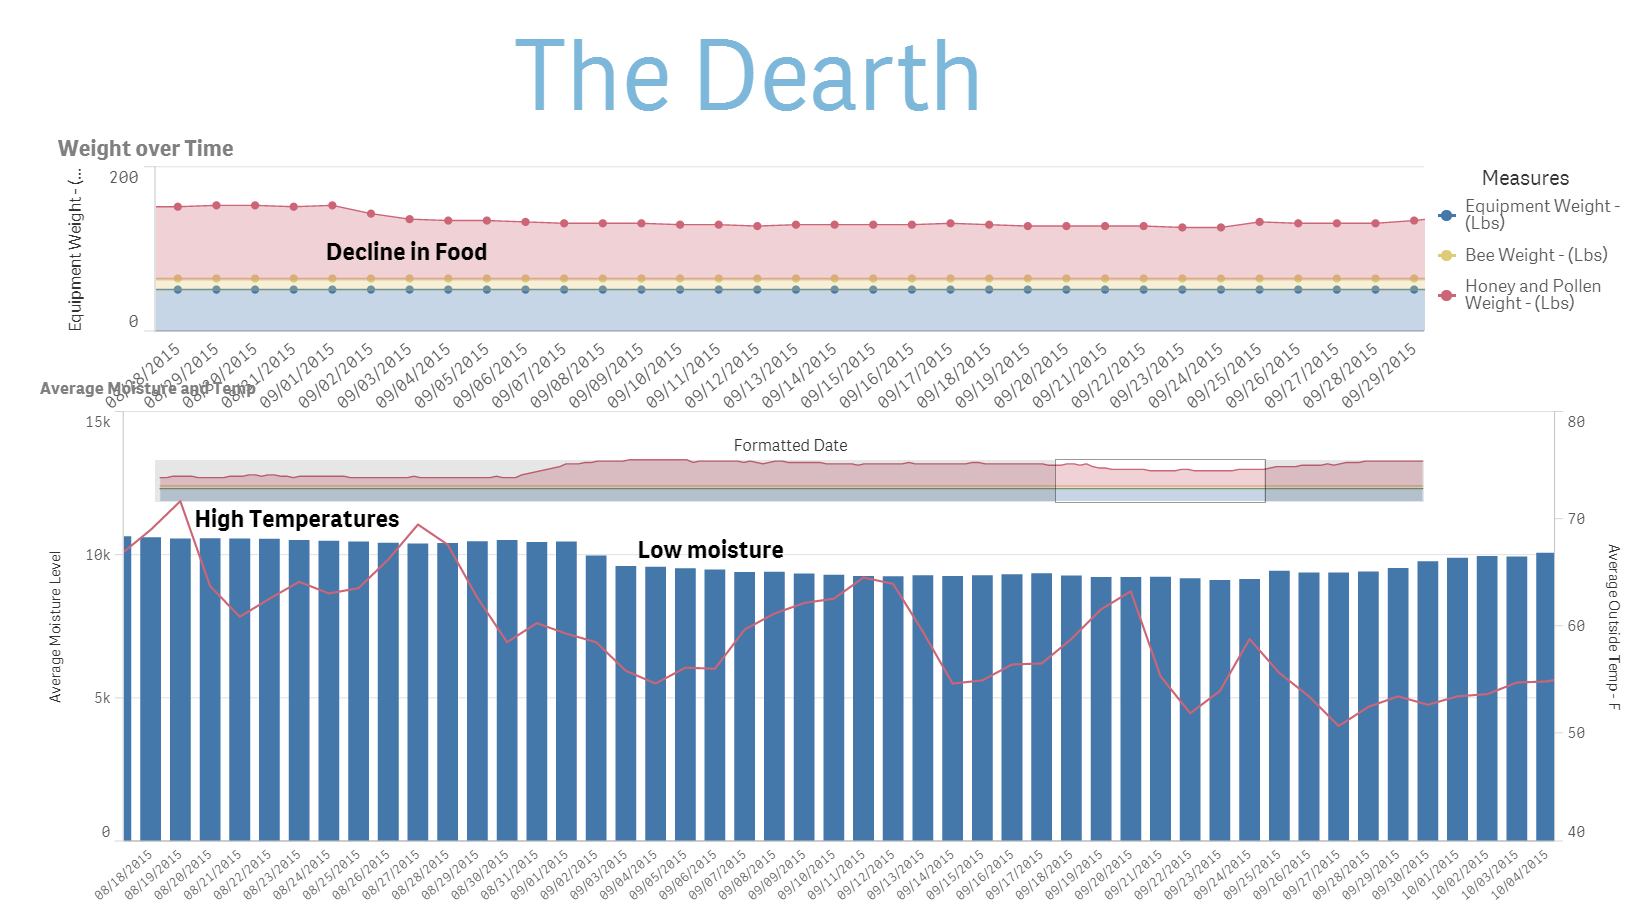
The next event took place in September, and was something I was hearing in the PSBA meetings anecdotally. There was a fairly large dearth this year that caused many hives to run out of food before winter ever hit. The dearth is a period of time where there is no access or limited supply of natural food sources, and the weather is typically hot and dry. Bees rely on backup food reserves during this period, and if a beekeeper took too much of that blackberry honey, the bees might not have enough food to survive.
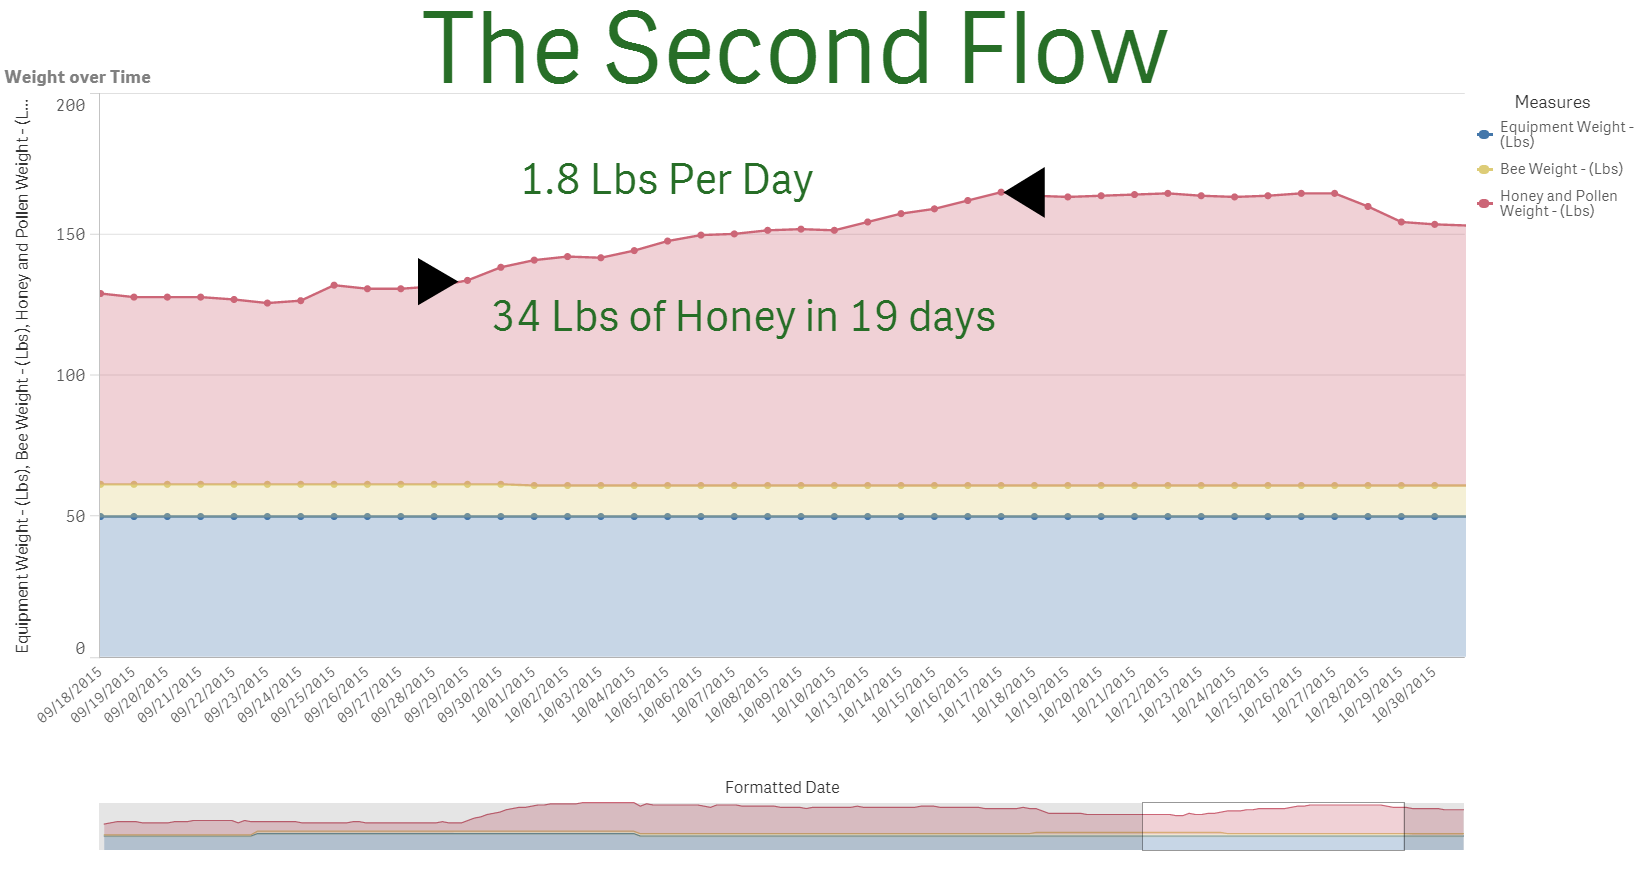
The bees that did make it through the dearth were rewarded with a second nectar flow. The rains returned, and many of the spring blossoms came back for a second nectar flow. The bees were high in population, with a majority being field bees, so this was a total slam dunk for many hives. The extra intake of pollen and honey during this period is exactly what the bees need to make it through the winter.
 All this data came from Danny’s single Arnia hive monitoring system, which was setup last Fall. We have collected over one year’s worth of data from this one hive and already learned so much. In 2016, we’re taking it up a notch. Danny has been working with a local electrical engineer that has been able to produce a cheaper version of a sensor that collects temperature and humidity. Danny also went out and recruited beekeepers within the community to help raise the funds and provide hives for the monitors. Over the past few weeks, he and his team have been out in apiaries all around Western Washington, installing 100 sensors on hives.
Next year, we’ll have 100 times the data, and 100 times the information that we can learn from it. As we progress with this and start to learn useful things about bees, we’ll share it with you. It’s our hope that this information will be used by you and other beekeepers to help keep bees alive and healthy.